Your Network's Edge®
Blog Post
You are here
What is Explainable AI? - Part II
In part one of this blog post series, Explanatory Models, I discussed why it’s important to explain a model, and identified how and which models can be explained.
As a data scientist and programmer, I understand the importance of not only building accurate models but also being able to interpret and communicate their findings effectively. This is where the concept of model explanation becomes paramount in our work. In this blog, we'll explore a variety of tools and techniques that are indispensable.
Explanation of Models
The model explanation provides trust and validation of the models we create. In addition, it conveys their findings to the relevant stakeholders. However, it's important to note that the tools for model explanation can differ significantly between traditional Machine Learning (ML) and Generative Artificial Intelligence (AI) approaches. In ML, we often rely on techniques such as feature importance analysis. However, in generative AI we focus on understanding the creative processes behind the generation of new content, such as images, text, or music.
The tools enable us to break down and understand the inner workings of our models, making our work robust and more transparent. Efficient code is at the heart of this endeavor, as it empowers us to perform these analyses swiftly and with precision. Whether you're working with traditional ML models or delving into the exciting world of generative AI, having the right tools is paramount. The mix of the correct tools and efficient coding is key to unlocking the true potential of your data science and AI projects.
Machine Learning:
When describing ML models, there are techniques and algorithms to assist with interpretation and explainability. Here are some main tools and algorithms:
LIME:
LIME (Local Interpretable Model-agnostic Explanations) is a popular technique for explaining machine learning model predictions. It focuses on providing locally faithful and interpretable explanations for individual predictions, irrespective of the underlying model type. It is "model-agnostic," meaning it can be applied to any machine learning model, including deep neural networks, decision trees, support vector machines, and more.
LIME's primary focus is generating local explanations, to understand predictions for specific instances rather than analyzing the overall model behavior. Its simplicity in fitting interpretable models to perturbed data makes it a powerful tool for understanding and debugging machine learning models. LIME is a valuable tool for enhancing the interpretability of machine learning models and gaining insights into why they make specific predictions for individual data points. Here’s how it works:
Select an Instance: To explain a specific prediction, choose the data point for which you seek an explanation regarding the model's prediction.
Perturb the Data: LIME operates with the assumption that it can generate an interpretable explanation for a local neighborhood of the selected instance. To create this neighborhood, LIME perturbs the selected instance by making small random changes to its feature values while keeping other features fixed. This generates a dataset of perturbed instances.
Predict with the Original Model: The next step is to obtain predictions for these perturbed instances using the original, complex machine learning model you want to explain. This results in a set of predicted outcomes.
Fit a Simple Model: LIME fits a simple, interpretable model (e.g., linear regression or decision tree) to the dataset of perturbed instances and their corresponding predicted outcomes. The goal is to create a model that approximates how the complex model behaves in the local neighborhood of the selected instance.
Interpret the Simple Model: Once the simple model is trained, it can be easily interpreted because it is inherently more transparent than the original complex model. You can examine the coefficients (in the case of linear regression) or the rules (in the case of a decision tree) to understand how each feature contributes to the prediction in this local context.
Feature Importance: LIME provides feature importance scores for the local explanation. These scores indicate how much each feature contributed to the prediction for the selected instance. They help you understand which features were influential in the model's decision for that particular data point.
Present the Explanation: The final step is to present the explanation to the user. This typically involves showing the feature importance scores Therefore, the feature that had the most impact on the prediction is highlighted. In addition, visualizations or text-based explanations can be used to communicate the findings.
SHAP
SHAP (SHapley Additive exPlanations) is another technique for explaining the predictions of machine learning models. It is based on cooperative game theory and Shapley values. SHAP provides a theoretically grounded framework for attributing feature importance to model predictions.
In addition, SHAP is also model-agnostic and can be applied to any machine learning model, including complex ones such as deep neural networks. It provides a theoretically sound and fair way to attribute feature importance, ensuring that the contributions of features are consistent and unbiased. SHAP values offer a global explanation of feature importance, helping users understand the overall behavior of the model. Here’s how it works:
Select an Instance: To explain a specific prediction, choose the data point for which you seek an explanation regarding the model's prediction.
Compute Shapley Values: SHAP operates by calculating Shapley values for each feature in the model. Shapley values are based on the idea of fair contributions in cooperative games. In this context, features are considered "players" in the game, and the prediction is the "winning coalition."
Generate All Possible Feature Combinations: For each feature, consider all possible combinations of features that could contribute to the prediction. This involves creating subsets of features and computing the prediction for each subset.
Calculate Marginal Contributions: For each feature, calculate its marginal contribution to the prediction in every possible combination of features. This is possible by comparing the model's prediction of whether the feature is and isn't included in the subset.
Average Marginal Contributions Across Combinations: After computing the marginal contributions for each possible combination, average these contributions across all combinations. This step ensures that the Shapley values represent the average effect of each feature on the prediction.
Apply Shapley Values: Apply the computed Shapley values to the model's prediction for the selected instance. This attribution process distributes the prediction's outcome among the features based on their Shapley values. Features with higher Shapley values are considered more important in explaining the prediction, while those with lower values are less important.
Present the Explanation: Communicate the explanation by displaying feature attribution values. SHAP offers various visualization techniques to represent these values effectively, such as summary plots, force plots, and dependence plots. These visualizations help users understand which features had the most significant impact on the model's prediction for the chosen data point.
In summary, SHAP is a powerful technique for explaining model predictions by attributing feature importance based on cooperative game theory principles. It provides interpretable and consistent explanations that can be valuable for understanding why a model made a specific prediction.
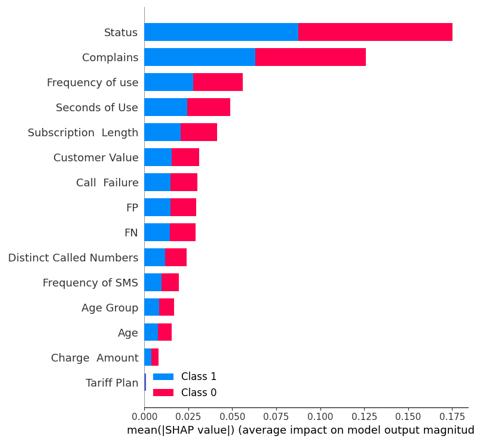
To illustrate how this model explanation works, let’s use it for a model I developed to forecast customer churn in telecom service. We first built a model using one of the ML methods, and then used SHAP to explain the model. This graph shows how each feature (i.e., a measurable property in the data used for prediction) contributes to the forecast:

We can see that the features “Status,” “Complaints,” and “Frequency of use” play a major role in predicting churn.
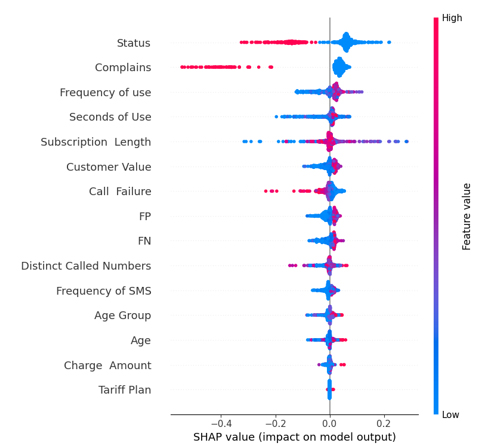
If we look at the feature “Complaints”, we will see that it is mostly high with a negative SHAP value. It means that higher complaint counts tend to negatively affect the output:

Now let’s look at the results of a test performed to determine which features contributed to the "1" value. We will examine the first sample in the testing set to determine which features contributed to the “1”. In order to do this, we utilized a force plot and provided the expected value, SHAP value, and testing sample:

We can see all the features with the value and magnitude that contributed to the loss of customers. It seems that even one unresolved complaint can cost a communications service provider its customers.
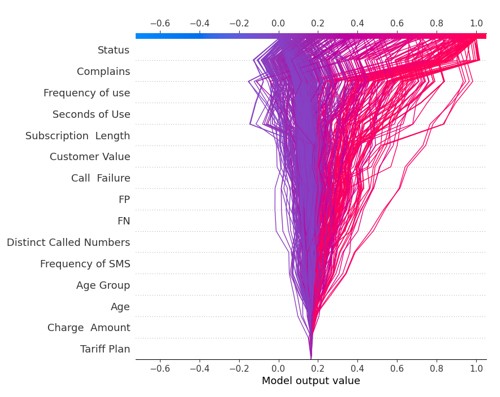
The following display lot visually depicts the model decisions by mapping the cumulative SHAP values for each prediction:

Each plotted line on the decision plot shows how strongly the individual features contributed to a single model prediction, thus explaining what feature values pushed the prediction.
Exploring Interpretability Tools: Python Packages for Transparent Machine Learning Models
Below is a list of Python packages based primarily on LIME and SHAP for transparency and explainability. Such packages can also use other programming languages, however, in this post, I’ll focus on Python:
ExplainerDashboard:
Explainerdashboard is a Python module that allows you to easily create an interactive dashboard that explains how a fitted machine learning model works. This enables you to open the 'black box' and demonstrate to consumers, managers, stakeholders, and regulators (and yourself) how the machine learning algorithm generates its predictions.
You can investigate various aspects, such as model performance, feature importance, feature contributions (SHAP values), what-if scenarios, (partial) dependencies, feature interactions, individual predictions, permutation importance, and individual decision trees. Everything is interactive. All with the bare minimum of code. In ExplainerDashboard, one can design how their GUI monitor interface can look like.
Explainable Boosting Machines (EBM):
Explainable Boosting Machines (EBMs) are a type of machine learning model that is accurate and interpretable. EBMs can provide insights that explain which features are most important for the model's predictions.
EBMs work by iteratively adding weak learners to a model and training them to correct previous learners errors. This process is known as boosting.
EBM is different from other boosting algorithms in that it uses additive models, which means that the final prediction is a sum of the predictions of the individual learners. This makes EBMs more interpretable, as it is easy to see how each feature contributes to the final prediction. In addition, EBMs can automatically detect interactions between features. This means that they can learn that the effect of one feature on the prediction depends on the value of another feature. This makes EBMs even more interpretable, as it can help us to understand the complex relationships between features.
Shapash
Shapash is a Python package focused on making Data Science models interpretable. It includes numerous styles of visualization that provide explicit labels that are understandable to everyone. Data Scientists may better understand their models, discuss their findings, and document their projects in an HTML report. Users can understand a model's recommendation by the summary, which shows the most significant criteria.
Eli5
Eli5 (Explain like I am 5): ELI5 is a Python package that helps us understand and debug machine learning classifiers and how they make predictions. It works like a detective. Imagine you have a friend who is really good at solving puzzles. ELI5 is like that friend, but for machine learning. When you have a computer program that is supposed to guess things, such as whether a picture has a cat or a dog, ELI5 helps you understand how it makes those predictions. When your machine learning program says, "I think this is a cat," ELI5 can tell you why it thinks that. It might say, "I saw pointy ears and a furry tail, so I presumed it is a cat." ELI5 can also find “mistakes” (wrong classifications), such as the computer thought this was a cat, but it is actually a dog! So, ELI5 is like a helpful friend who makes machine learning less mysterious. It explains how the computer makes guesses and helps you find any errors it makes. There are other packages that can be investigated further, such as Alibi, which covers strategies such as Anchors. Skater is yet another package that began as a branch of LIME but later evolved into its own framework. Other initiatives worth investigating are EhticalML, Aix360 by IBM, Diverse Counterfactual Explanations (DiCE) for ML, which stems from the interpret ML that we discussed before for EBMs, ExplainX.Ai, and more.
The Correct Tools
When selecting a tool for model explanation, consider the following factors:
Model Type: Your decision will be influenced by the sort of model you're working with. Linear models may be easily interpreted using basic methods, but complicated models such as neural networks may need more sophisticated approaches such as SHAP or TCAV.
Type of Data: Think about the type of data you are using. While some tools work well with structured data, others do a better job with unstructured data like text or photos.
Interpretability Needs: Determine the appropriate level of interpretability. Are you describing individual forecasts, global model behavior, or the significance of features? Each tool has its strength distinct areas of interpretation.
Complexity vs. Simplicity: Consider the trade-off between model complexity and interpretability. Model distillation, for example, can reduce complicated models while maintaining performance.
Efficiency of the Tool: As efficiency is important to you, assess the computational requirements of the tool. Efficient code is essential for quick analysis.
Domain Expertise: Your topic expertise is essential. Some tools could be more in line with how you understand the problem in your particular domain.
Explainability in Generative AI:
Generative AI could be considered a creative machine. It learns from existing data and generates new content, including music, or text. It's similar to an artist who can paint new pictures by studying old ones.
An explainable generative AI model can increase model credibility and provide developers of enterprise-level use cases more assurance. Throughout the whole development process, explainability must be carefully thought out and planned. (You may even inquire about this on ChatGPT.).
Here Are Some Key Guidelines:
Human supervision is required. In some circumstances, human intervention is vital to ensure the generative AI model makes responsible and ethical judgments. A person, for example, may be entrusted with checking a model's output to ensure it is not producing damaging or biased information. Various groups of individuals can access data sets and assist with identifying non-obvious biases. This has shown to be effective in finding accidental heterogeneity, which leads to model bias. Furthermore, skilled individuals from diverse backgrounds may analyze algorithms against regulations and standards (corporate or government) to identify any ethical issues with data usage or model results.
Simplifying the model. Understanding how AI models arrive at conclusions or predictions gets increasingly challenging as they become more complicated. Deep learning models, for example, might have dozens, if not millions, of parameters. Reducing the number of layers in a neural network simplifies the model's design, enhancing our ability to comprehend and interpret its decision-making.
Tools for determining interpretability. There are several tools available to assist developers in interpreting the decisions made by a generative AI model. Attention maps, for example, may be used by model trainers to see which sections of an input picture are most significant for the output. Other methods, such as decision trees or feature importance plots, can be used by model developers to discover the vital aspects that impact a model's choice.
Explainability AI in Networking:
Network managers use AI to enhance network performance, security, and efficiency. In addition, they use AI in many different ways, including anomaly detection, predictive maintenance, resource allocation, network optimization, load balancing, QoS maintenance, troubleshooting, capacity planning, policy compliance, reporting, automation, machine learning for traffic prediction, and ethical considerations.
AI tools provide insights and automation, allowing network managers to focus on strategic planning and decision-making. Explainable AI allows them the confidence to make fateful decisions based on artificial intelligence.
Explainability in AI is crucial for data scientists and programmers. It ensures understanding and trust in AI models, especially in sensitive fields like healthcare, finance, communication, and networking. AI packages (e.g., LIME, SHAP, or what we mentioned above) provide tools to interpret model predictions. You can enhance explainability by choosing interpretable models or using hybrid approaches. Combining AI explainability with domain expertise is valuable. Consider ethical implications, stay updated on evolving techniques, and create user-friendly documentation if you develop explainability tools.

